Exchange Ranking
 Top Exchanges
 24h Volume Ranking
 Popularity Ranking
 Exchange BTC Balance
 Proof of Reserves
 Decentralized Exchanges
 Funding Rate
 Funding Heatmap
 Liquidation Data
 Max Pain
 Long/Short Ratio
 Whale L/S Ratio
 Binance/Okex/Huobi L/S
 Bitfinex Margin L/S
 ETF Tracker
 Solana ETF
 XRP ETF
 Hong Kong ETF
 Bitcoin Treasuries
 Crypto Reversal
 Ethereum Reserves
 HyperLiquid Wallet Analysis
 Hyperliquid Whale Watch
 Large Transactions
 On-chain Movement
 Bitcoin ROI
 Stablecoin Market Cap
 Options Analysis
 News
 Articles
 Economic Calendar
 Features
 Wallet
 Contract Calculator


 Security
 Collections
 Watchlist
 Following
 XRP
Recently, the price of Ripple (XRP) has been declining continuously, causing many investors to wonder: will this decline end? In fact, there are four main factors contributing to this situation. From market sentiment to technical aspects, and even policy factors, each of these can hinder XRP’s ability to rebound. If you want to understand why XRP might continue to fall, this article will help you understand the situation better and give you a clearer view of the market trends.
Key points:
● XRP has confirmed a bearish descending triangle pattern on the daily chart. It could fall by 18% to $2.40.
● The decrease in the number of active addresses indicates reduced trading activity, leading to a decline in demand for XRP.
● The difference between buy and sell prices remains negative, indicating weaker investor demand.

Ripple (XRP) has fallen by 23% from its peak of $3.66 over the years. Multiple indicators suggest that its price may further drop towards $2.40.
Data from Cointelegraph Markets Pro and TradingView shows that XRP has broken below the descending triangle pattern on a daily basis, as shown in the chart below.
A descending triangle is a typical bearish pattern, characterized by a flat horizontal support line and a downward trend line.
On Tuesday, the price fell below the key chart-level support at $2.95, continuing its downward trend. The target is $2.40.
This trend means that XRP could experience a cumulative decline of 18% from its current level.
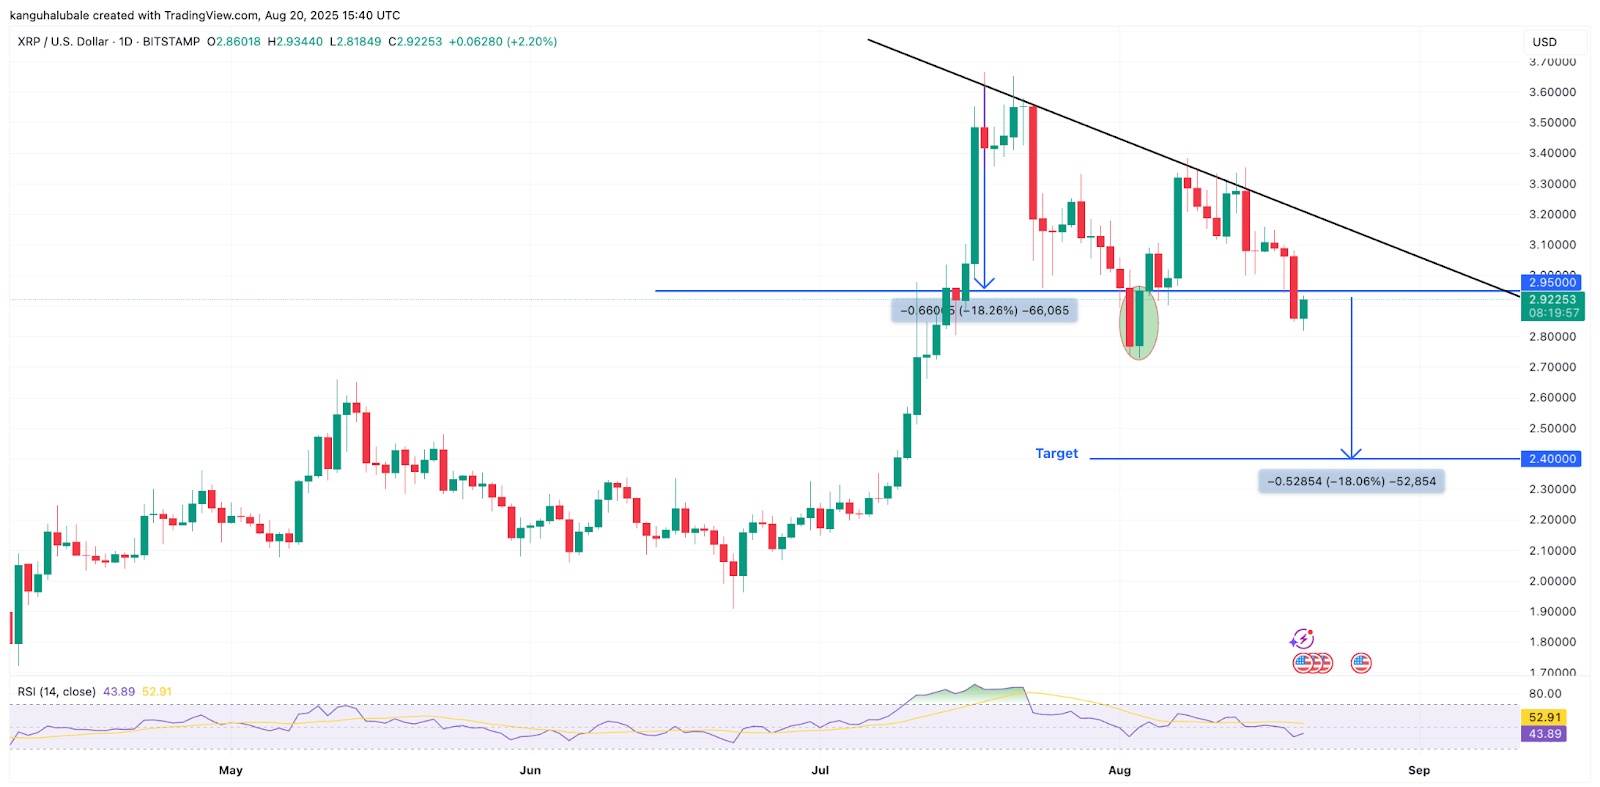
Daily chart of XRP/USD
As reported by Cointelegraph, altcoins need to regain the $3 support level to avoid further declines to around $2.24. The last two times prices managed to regain this level were in mid-July and early August, resulting in rebounds of 25% and 15%, respectively.
There is a negative divergence between XRP/BTC and the Relative Strength Index (RSI).
XRP’s bearish trend is supported by the growing negative divergence between XRP/BTC and RSI.
The chart below shows that XRP/BTC increased from July 10 to August 18, reaching higher lows.
However, during the same period, the daily RSI dropped from 75 to 43, indicating lower lows.
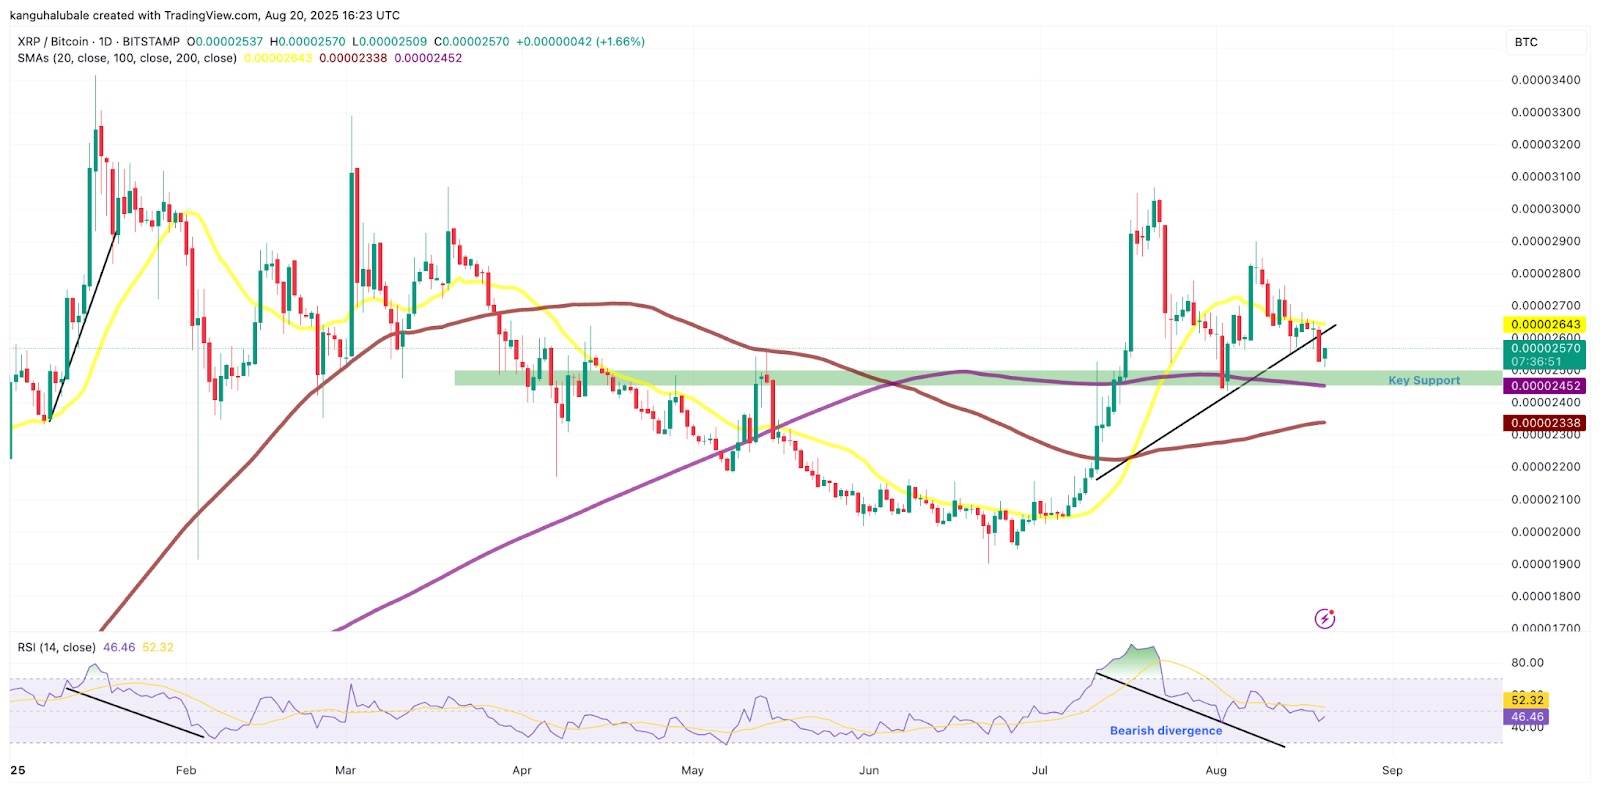
The daily chart of XRP/BTC shows a negative divergence between price drops and rising RSI. This typically indicates weakness in the current uptrend, prompting traders to sell at higher levels due to decreased investor interest and exhaustion among buyers.
The chart also shows that XRP/BTC is above key support levels between $0.0000245 BTC and $0.0000250 BTC, supported by the 200-day simple moving average.
If this area is broken, it could lead to further declines in XRP/BTC, as XRP prices would continue to fall.
A decline in network activity could exacerbate the selling pressure on XRP.
Compared to the first quarter of 2025 and the period from June to July, network activity for the XRP Ledger has significantly decreased. Data from Glassnode shows that the number of active addresses on the network is now much lower than in March and June.
The ledger recorded 608,000 DAAs on March 19th, and 577,134 on June 16th. This indicates high user engagement and trading activity. However, from the end of June to August, there was a significant decline, as shown in the chart below.
The number of active addresses decreased to just around 33,000 per day, indicating reduced user activity. This could suggest a decrease in interest or confidence in XRP’s short-term prospects.
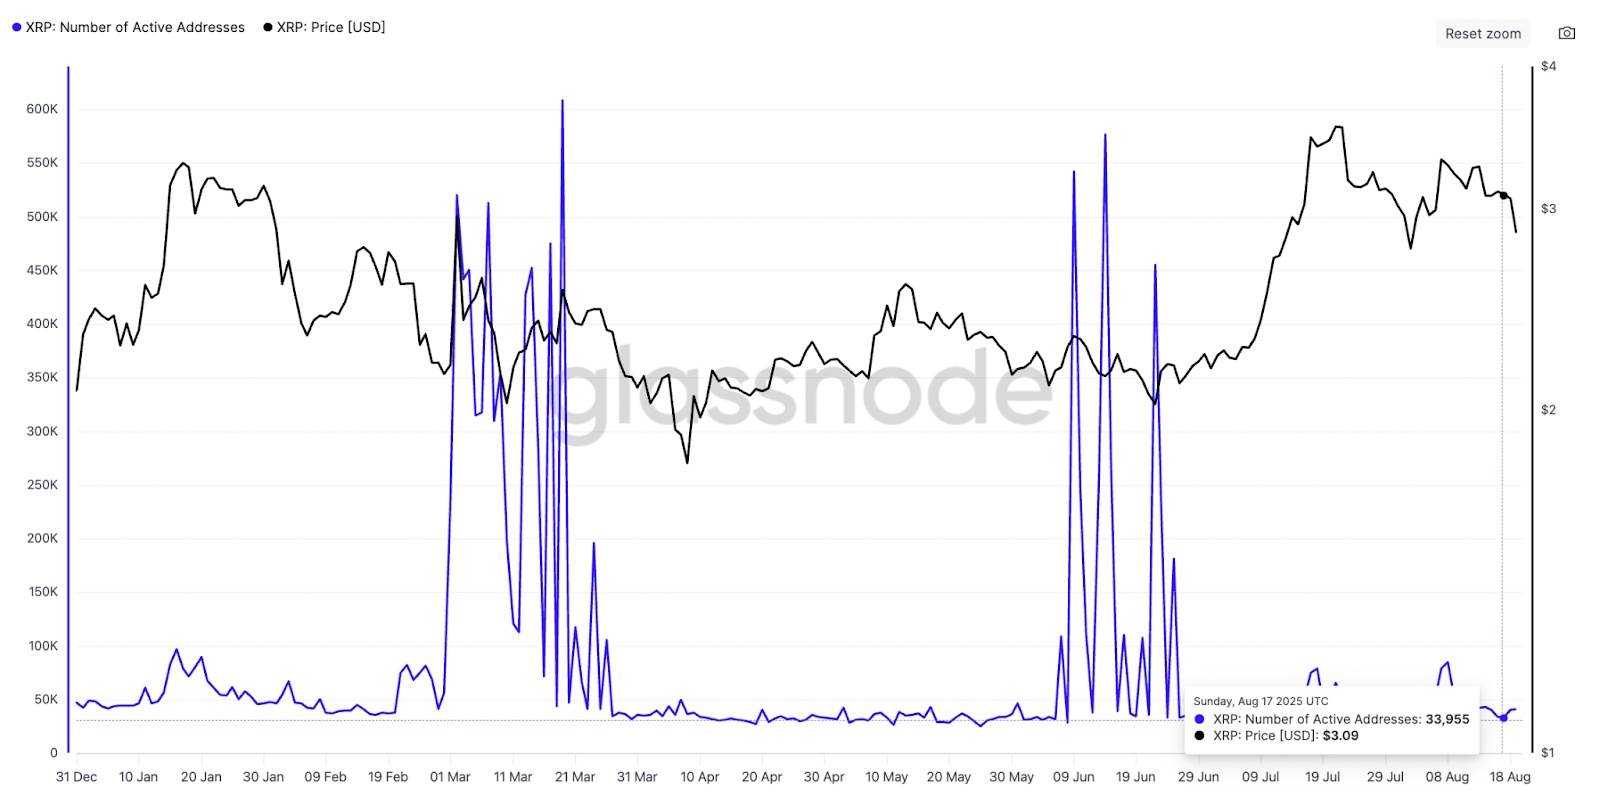
Historically, declines in network activity often signal potential price stagnation, as lower transaction volumes reduce liquidity and purchasing momentum.
According to CryptoQuant, transaction volumes also decreased significantly, from 2.5 million in June to 1.25 million at the time of writing.
Transaction volumes and the number of active addresses are used to estimate the number of users interacting with the network. These metrics provide valuable insights into overall network activity and user engagement, making them key indicators of blockchain adoption and interaction with underlying tokens.
Therefore, these significant declines in online metrics could lead to a decrease in the value of XRP, potentially causing speculation about further price drops in the short term.
The 90-day spot CVD shows negative support for XRP, indicating a downward trend.
Analyzing the difference between total buy and sell volumes over 90 days reveals the extent of increased selling activity.
CVD measures the difference in trading volume over three months.
Since July 28th, when the exchange rate between XRP and USD reached a multi-year high of $3.66 on July 18th, sellers have taken control of the market.
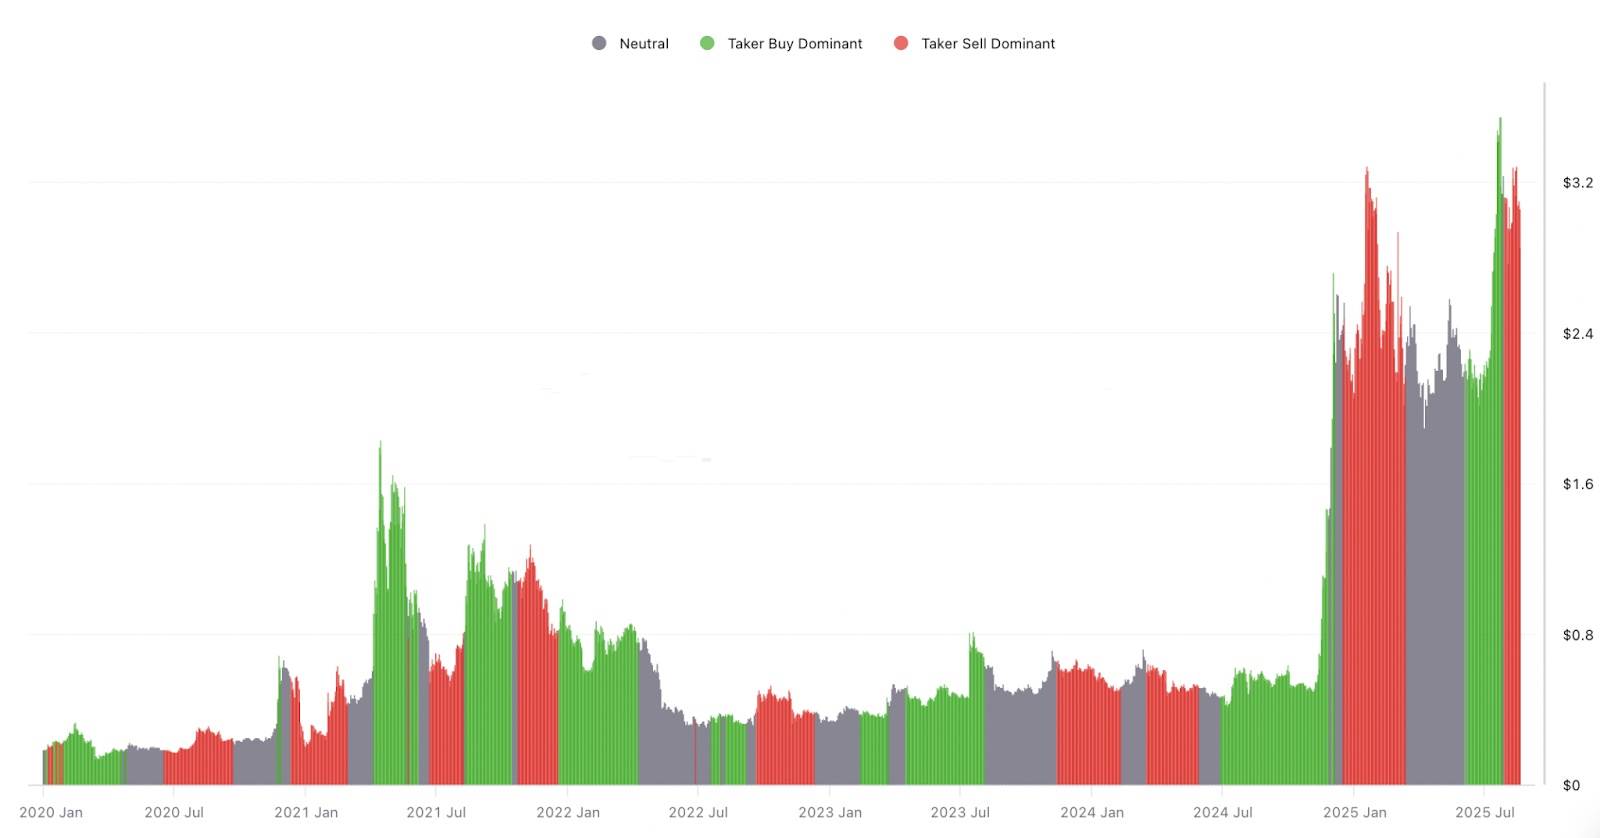
The negative CVD trend (the red bar chart in the above image) indicates that traders are taking profits, suggesting a decrease in demand and a shift in power to the sellers.
If CVD remains red, it means that sellers are not willing to retreat, which could lead to another decline, as seen in past corrections.
Currently, over 91% of XRP tokens are still in a profitable state. Investors may continue to lock in their gains, thereby further pushing prices down.