Exchange Ranking
 Top Exchanges
 24h Volume Ranking
 Popularity Ranking
 Exchange BTC Balance
 Proof of Reserves
 Decentralized Exchanges
 Funding Rate
 Funding Heatmap
 Liquidation Data
 Max Pain
 Long/Short Ratio
 Whale L/S Ratio
 Binance/Okex/Huobi L/S
 Bitfinex Margin L/S
 ETF Tracker
 Solana ETF
 XRP ETF
 Hong Kong ETF
 Bitcoin Treasuries
 Crypto Reversal
 Ethereum Reserves
 HyperLiquid Wallet Analysis
 Hyperliquid Whale Watch
 Large Transactions
 On-chain Movement
 Bitcoin ROI
 Stablecoin Market Cap
 Options Analysis
 News
 Articles
 Economic Calendar
 Features
 Wallet
 Contract Calculator


 Security
 Collections
 Watchlist
 Following
 BTC
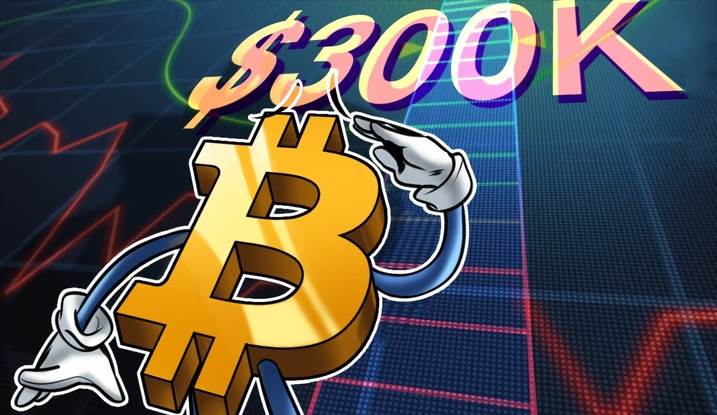
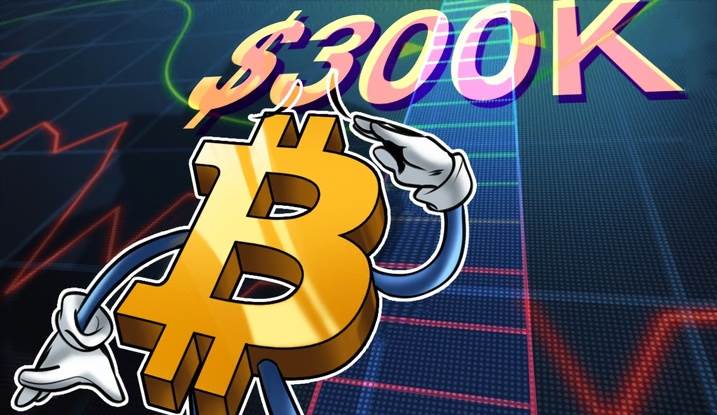
After going through countless fluctuations, Bitcoin still retains its momentum for further growth. Many analysts believe that the current market structure and trends in capital flow indicate that Bitcoin’s journey is far from over. The target price of $300,000 remains within reach. Whether it’s the expectation of a relaxed macroeconomic environment, continuous inflows of institutional funds, or the strong confidence of long-term investors, all these factors are contributing to the preparation for another surge in Bitcoin prices. For investors, this bull market may just have begun.
Key points:
● Although Bitcoin has reached a new high of $126,000, data from the blockchain shows that the market is not yet overheated.
● The “cup-and-handle” pattern of Bitcoin targets $300,000, and there are several factors supporting this target.
After hitting a new high of $126,000 on Monday, the current trading price is still about 4% below that level. With Bitcoin prices hovering around $122,000, many market analysts believe that this bull market is not over yet.
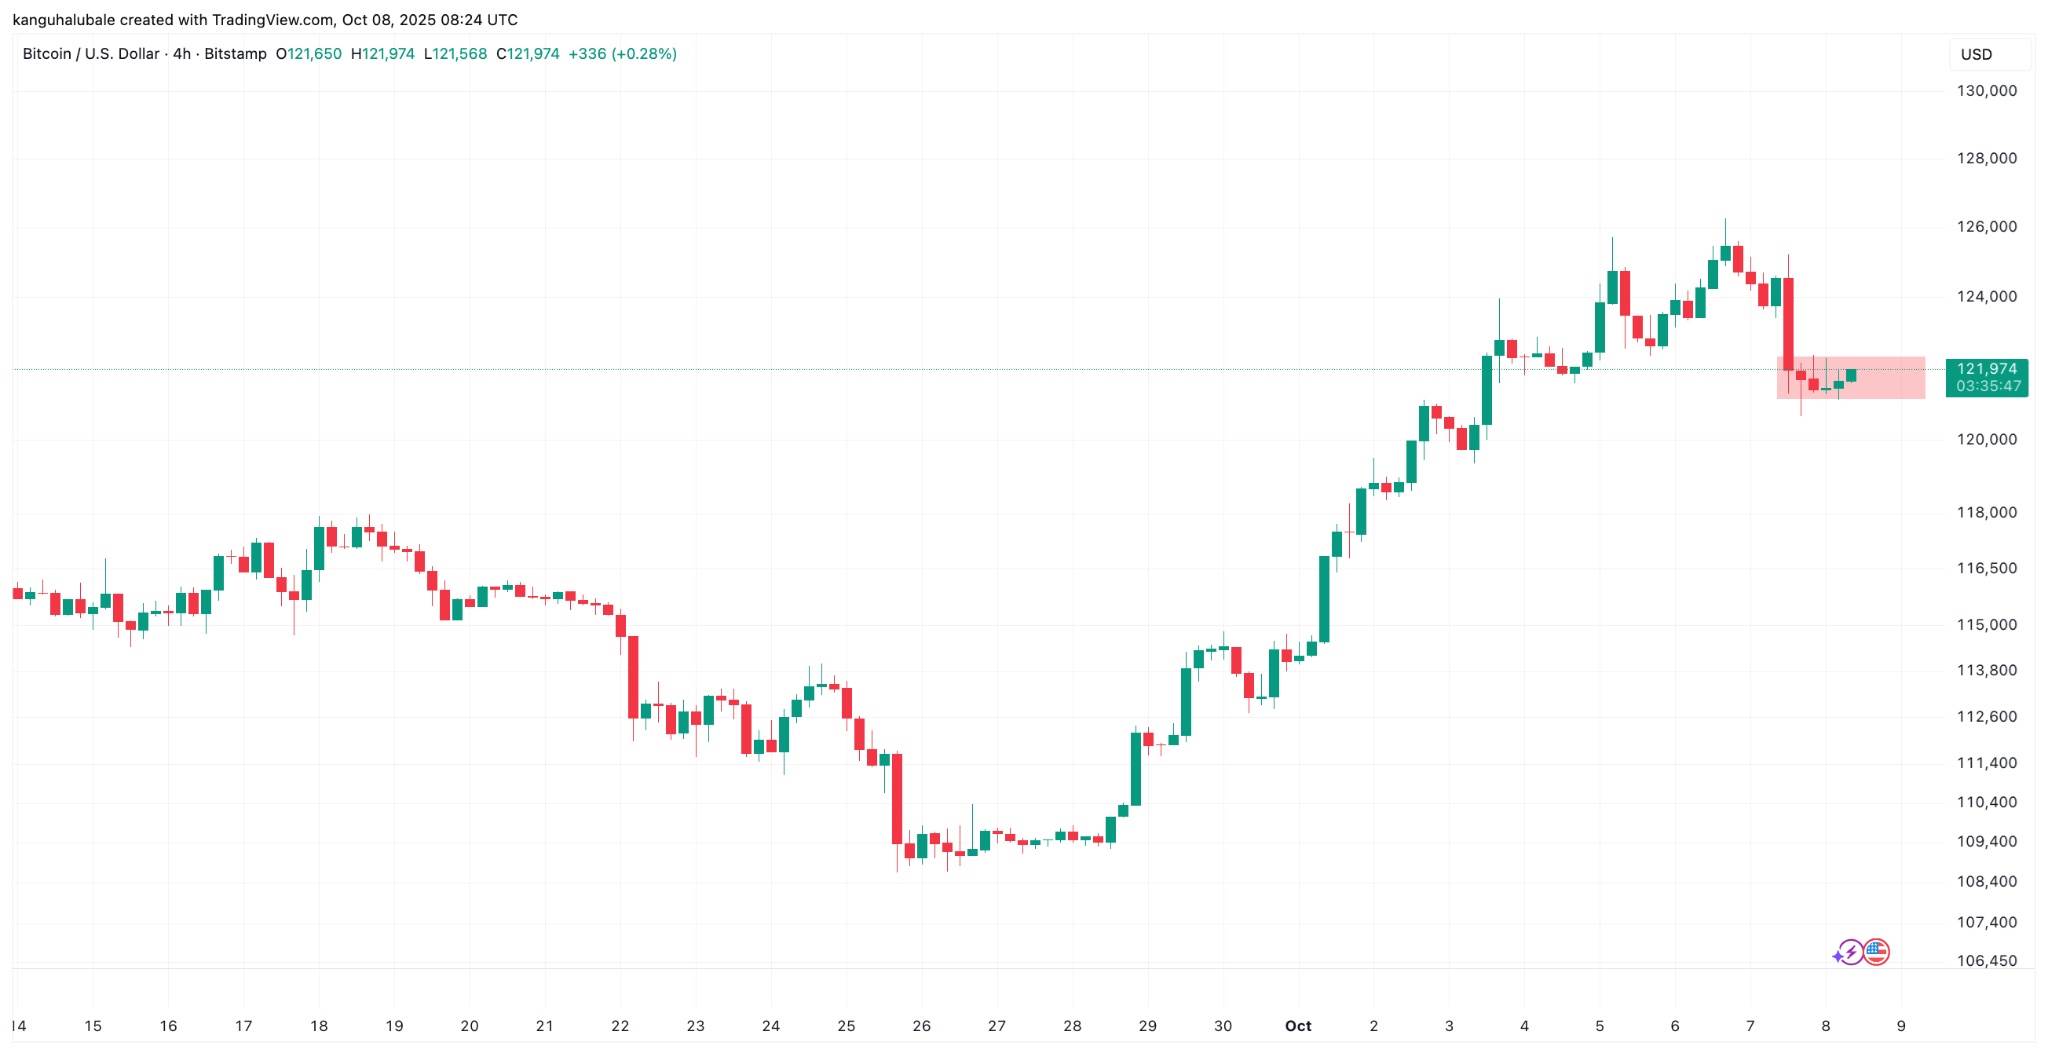
Four-hour chart of BTC/USD. Source: Cointelegraph/TradingView
The Bitcoin market is not yet overheated.
Cryptocurrency analyst Mark Moss believes that Bitcoin has not yet reached its peak.
Although Bitcoin prices are close to historical highs, its MVRV Z score is much lower than usual levels associated with market tops. This divergence suggests that there may be further room for growth in Bitcoin prices.
MVRV Z分数衡量BTC市场价值与其实际价值之间的偏离程度,实际价值是指投资者实际投入网络的资本。
Mark Moss在周二的X平台发文表示:“BTC突破新高,但它看起来离周期性顶峰还有很长的距离。”
他还表示,包括美国联邦储备的量化宽松(QE)、创纪录的现货BTC流入、BTC财库公司持续购买以及市场转向“贬值交易”在内的正面基本面因素,都可能推动BTC价格在2025年第四季度继续上涨。
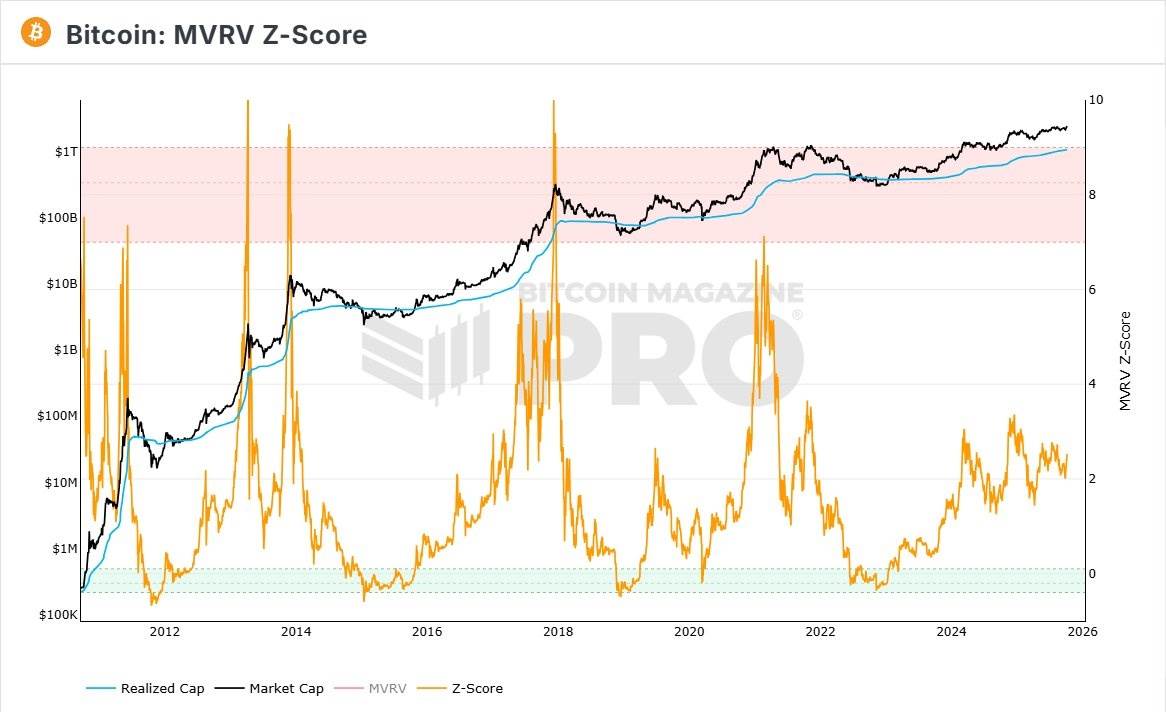
BTC MVRV Z分数图。来源:Bitcoin Magazine
同样,CoinGlass的牛市顶峰信号,选取了30个可能触发卖出信号的指标,用于捕捉长期BTC价格的顶部,目前并没有显示市场过热的迹象。事实上,所有指标均未发出顶部信号。
YouTuber Jesus Martinez特别指出了“Pi Cycle Top”指标,证明了“BTC仍有很大的增长空间。”
“美元正在崩溃,全球货币体系也在瓦解,考虑到市场仍未出现像2021年那样的零售投资兴趣,我们仍处于增长阶段,”Martinez表示,并补充道:
“Pi Cycle Top指标显示BTC目前的目标是20万美元。”
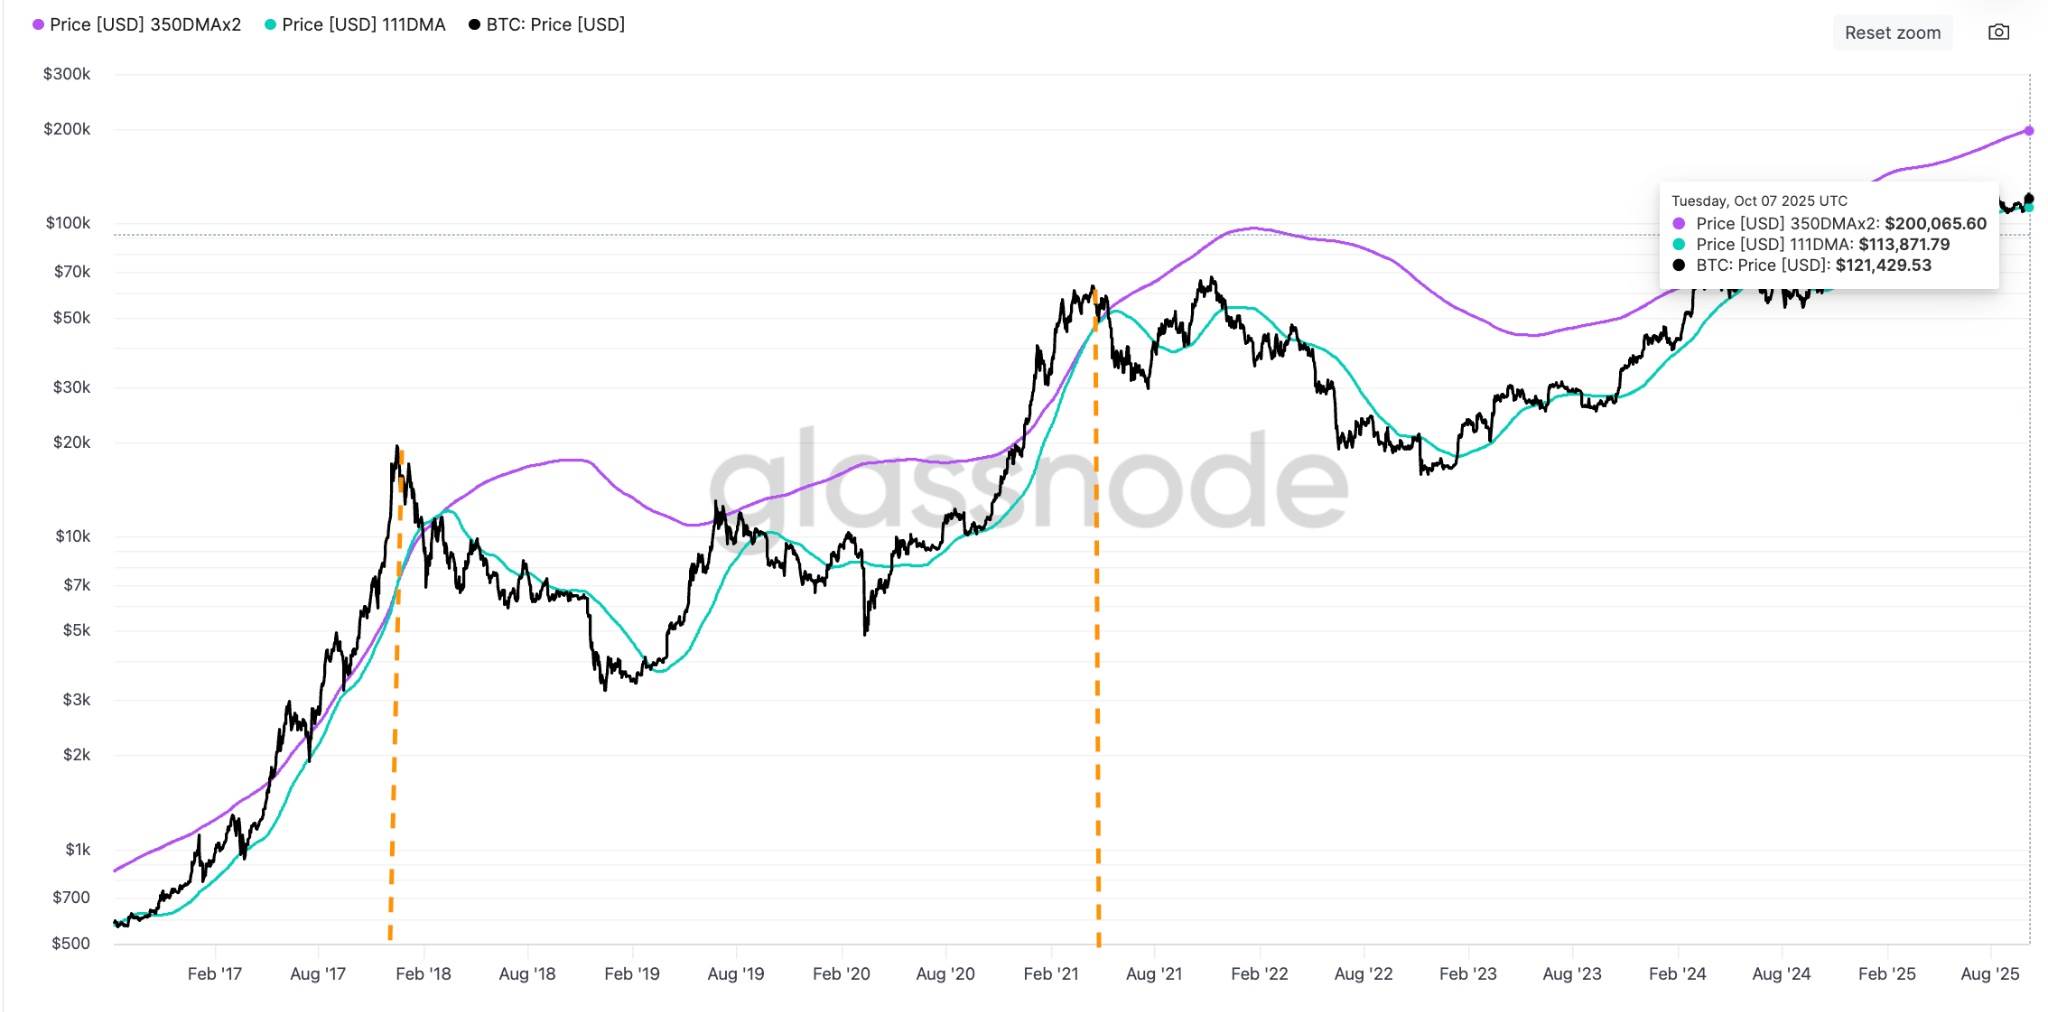
BTC:Pi Cycle Top指标。来源:Glassode
Cointelegraph also reported that the MVRV pricing range for short-term BTC holders is significantly lower than the overheating level, indicating that there is still room for further appreciation in BTC prices.
BTC prices could potentially rise to $300,000 per unit.
Looking at the weekly chart, BTC prices broke through the “cup-handle” pattern’s neckline at $69,000 per unit in November 2024. Currently, the BTC/USD pair is still verifying this breakthrough, and it may continue to rise, reaching the maximum distance from the bottom of the cup to the neckline.
According to chart analyst Gert van Lagen, the target price for this breakthrough is around $303,000 per unit between 2025 and 2026.
This increase means that BTC prices could rise by 147% from the current level.
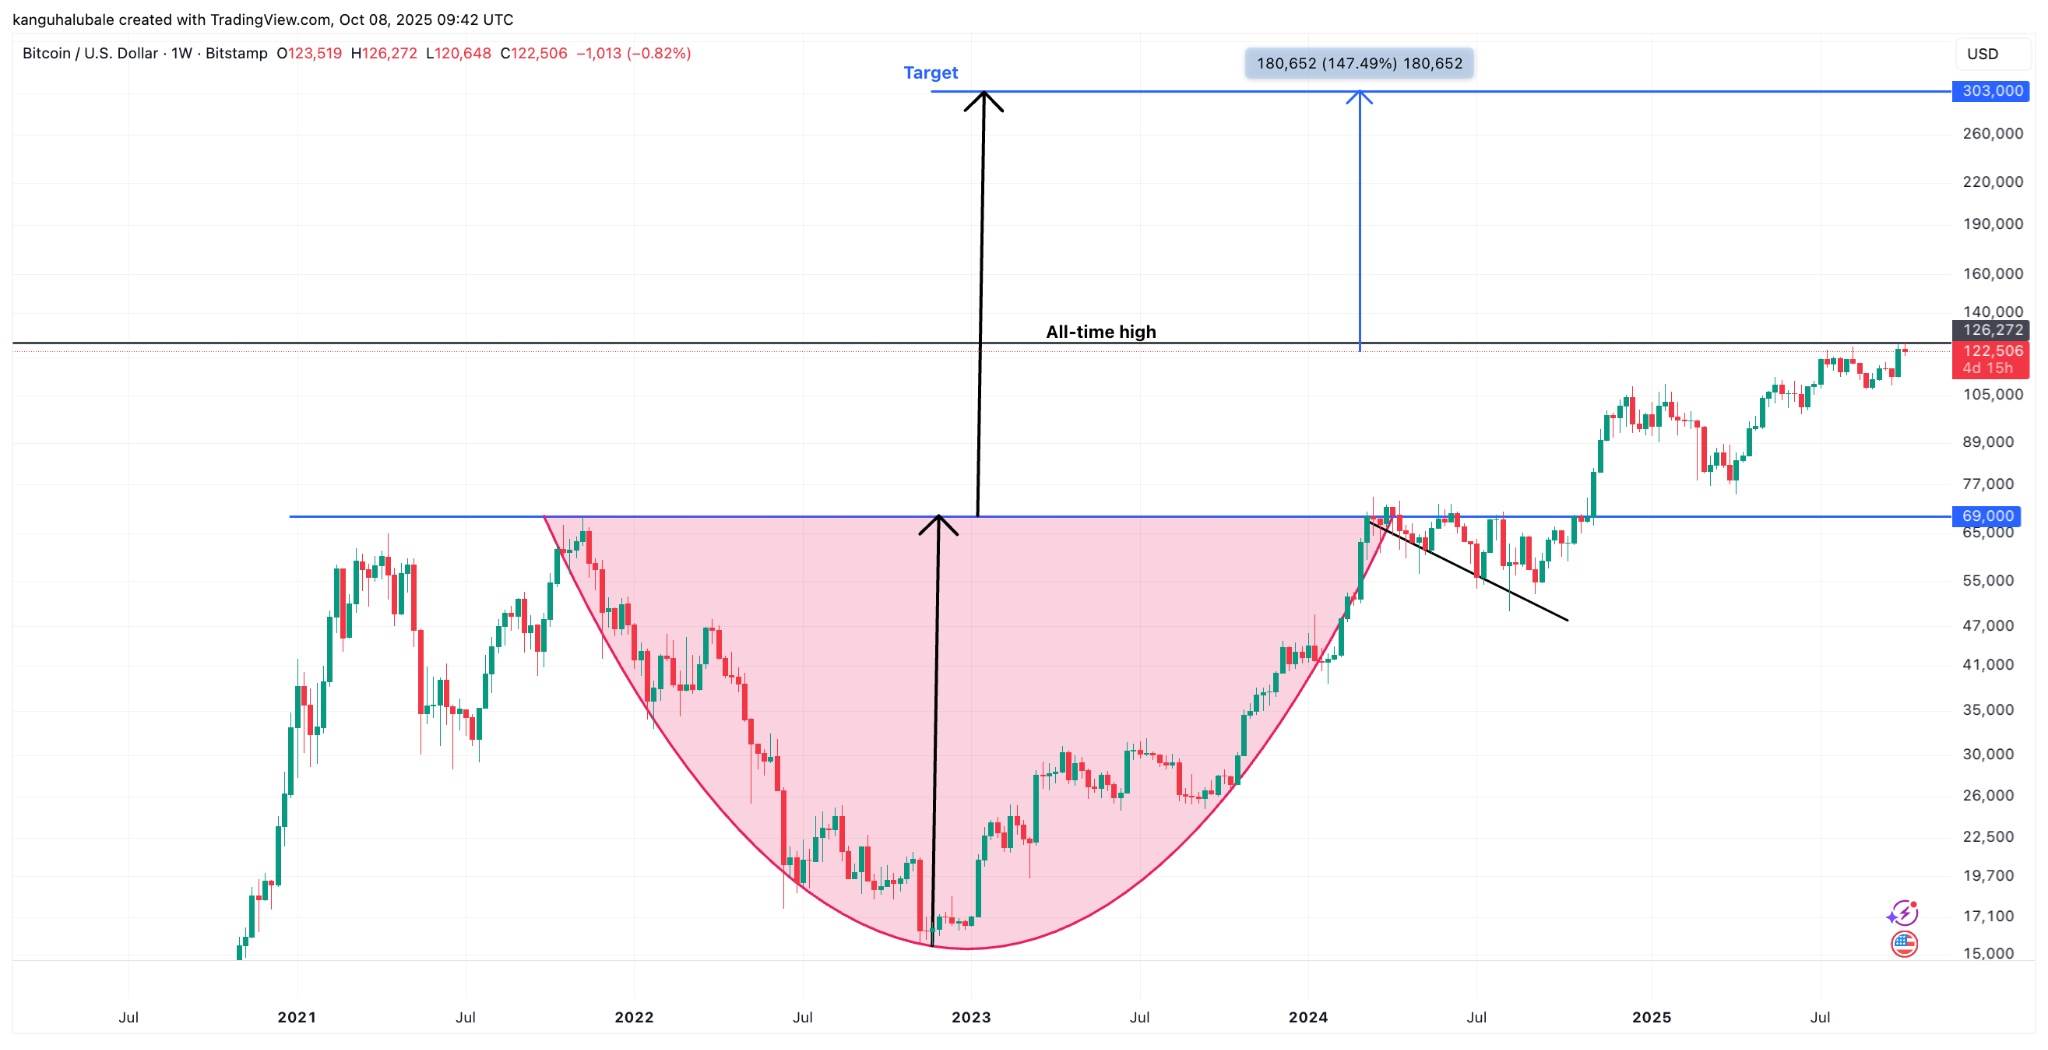
Weekly chart of BTC/USD. Source: Cointelegraph/TradingView
Technical analyst Jonathan Carter said, “The new historical high of BTC is just the beginning,” and emphasized the similar patterns seen in two-day charts.
He stated that after successful breaking through, the BTC/USD pair could “reach targets of $135,000, $145,000, and $160,000 per unit.” He added,
“The long-term bullish target for this cycle is expected to be between $200,000 and $250,000 per unit.”
As reported by Cointelegraph, with strong profit-taking at higher levels, BTC prices may retest the $114,000 per unit level, which could provide an opportunity for entry into future upward movements.