Exchange Ranking
 Top Exchanges
 24h Volume Ranking
 Popularity Ranking
 Exchange BTC Balance
 Proof of Reserves
 Decentralized Exchanges
 Funding Rate
 Funding Heatmap
 Liquidation Data
 Max Pain
 Long/Short Ratio
 Whale L/S Ratio
 Binance/Okex/Huobi L/S
 Bitfinex Margin L/S
 ETF Tracker
 Solana ETF
 XRP ETF
 Hong Kong ETF
 Bitcoin Treasuries
 Crypto Reversal
 Ethereum Reserves
 HyperLiquid Wallet Analysis
 Hyperliquid Whale Watch
 Large Transactions
 On-chain Movement
 Bitcoin ROI
 Stablecoin Market Cap
 Options Analysis
 News
 Articles
 Economic Calendar
 Features
 Wallet
 Contract Calculator


 Security
 Collections
 Watchlist
 Following
 LINK
LINK rallies to around $13.00
LINK rallies to around $13.00 after falling to $12.20, with resistance at $13.20 and support at $12.50 and $12.20 respectively. Analysts believe LINK's performance on Bitcoin could be a retest, suggesting prices could bottom out near current levels.
Investor Jordan re-opened positions in three buying ranges. Although the MACD double line is still below the zero axis, the positive MACD histogram signal shows that momentum is improving.
Chainlink (LINK) is trying to recover from a decline of more than $15.50 in late September, and analyst Michael van de Poppe and investor Jordan are discussing its prospects. Van de Poppe believes LINK's performance against Bitcoin may be a retest, while Jordan said he has re-purchased LINK in three price ranges. On October 11, LINK traded at $12.853.
LINK rebounded after falling to $12.20.
LINK fell from about $13.30 on October 7 to about $12.20 on October 9, and then rebounded to around $13.00. The decline followed a rally, rising from about $10.70 in mid-September to more than $15.50 around September 29. 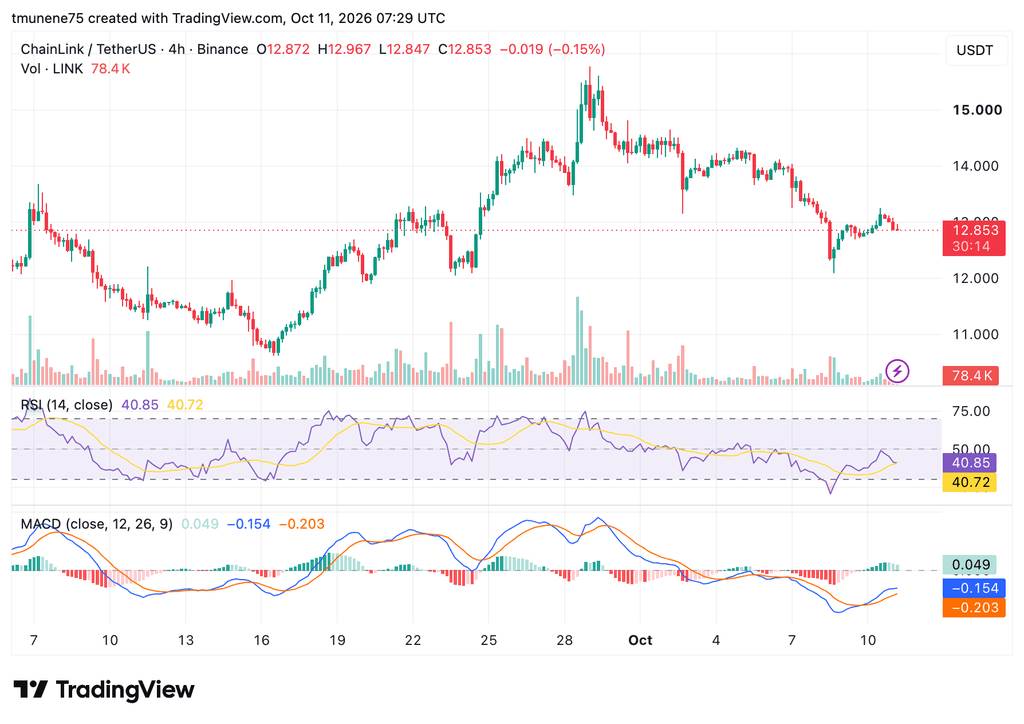 Source: TradingView
However, recent consecutive declines in highs suggest that previous gains have lost momentum. Despite a recovery from October lows, LINK fell 0.15% in Binance's latest four-hour candle chart.
Direct support is around $12.50, followed by $12.20. If buyers hold on to these levels, LINK may again test resistance levels between $13.00 and $13.20. If we can continue to break through this range, it may open up space for US$13.50 and US$14.00; if we fall below US$12.20, US$12.00 will become the next target of attention.
Van de Poppe believes LINK may have hit bottom
Michael van de Poppe described the market pullback as a relatively severe situation for LINK. However, he said LINK's performance on Bitcoin looked more like a retest than a deeper deterioration. https://cryptofrontnews.com/wp-content/uploads/2026/10/HURu-xAWMAAw84-1-1024x583.jpeg Source: Michael van de Poppe
The analyst said he was observing possible rebounds and potential lows, which could be near the current region. His assessment focuses on LINK's performance relative to Bitcoin during the broader market downturn.
Meanwhile, the four-hour Relative Strength Index (RSI) was 40.85, slightly above its moving average of 40.72. Both readings were below the neutral level of 50, although kinetic energy has improved slightly.
Investor Jordan re-entered LINK in three buying ranges
Investor Jordan said he sold close to $15 and then invested five-digit sums in all three buying ranges. He added that if his final entry level triggers, he still has available funds. https://twitter.com/InvestorJordan/status/2108633609670377650? s=20
The four-hour MACD histogram is positive 0.049, the MACD line is-0.154, and the signal line is-0.203. This indicates a bullish crossing attempt, although the two lines are still below the zero axis. Trading volume was 78.4K, and a breakthrough of $13.20 remains critical to this recovery attempt.