Exchange Ranking
 Top Exchanges
 24h Volume Ranking
 Popularity Ranking
 Exchange BTC Balance
 Proof of Reserves
 Decentralized Exchanges
 Funding Rate
 Funding Heatmap
 Liquidation Data
 Max Pain
 Long/Short Ratio
 Whale L/S Ratio
 Binance/Okex/Huobi L/S
 Bitfinex Margin L/S
 ETF Tracker
 Solana ETF
 XRP ETF
 Hong Kong ETF
 Bitcoin Treasuries
 Crypto Reversal
 Ethereum Reserves
 HyperLiquid Wallet Analysis
 Hyperliquid Whale Watch
 Large Transactions
 On-chain Movement
 Bitcoin ROI
 Stablecoin Market Cap
 Options Analysis
 News
 Articles
 Economic Calendar
 Features
 Wallet
 Contract Calculator


 Security
 Collections
 Watchlist
 Following
 LTC
Recently, the price of Litecoin (LTC) has been quite active. It has rebounded from its previous low of $115 to around $129, with a rise of over 9%. The market sentiment has clearly improved. This increase is not only due to continuous buying by institutional and large-scale investors, but also because blockchain data shows that large amounts of funds are accumulating in certain addresses, sending strong bullish signals to the market. Additionally, the expectation of the approval of LTC spot ETFs has also increased, attracting more investors to participate. This has led to a rapid influx of funds, making this long-established “altcoin” once again a focus of attention.

Investors hoarding coins and the expectation of ETFs are the main reasons for the价格上涨。
Recent market data shows that since mid-September, approximately 300,000 LTC units (worth about $31.6 million) have been transferred to cumulative wallets. Analysts believe that this indicates that some funds are reversing their previous positions, where they were shorting Solana and longing LTC. This has tightened the supply-demand balance for LTC, providing support for its price.
Similar behavior of investors accumulating coins has occurred in past market reversals, and this round of activity has also contributed to increased volatility and price recovery.
Currently, LTC is hovering around $128, and it is trying to break through the key resistance zone of $135–140.
Technical indicators suggest that a bottom has been reached.
On weekly charts:
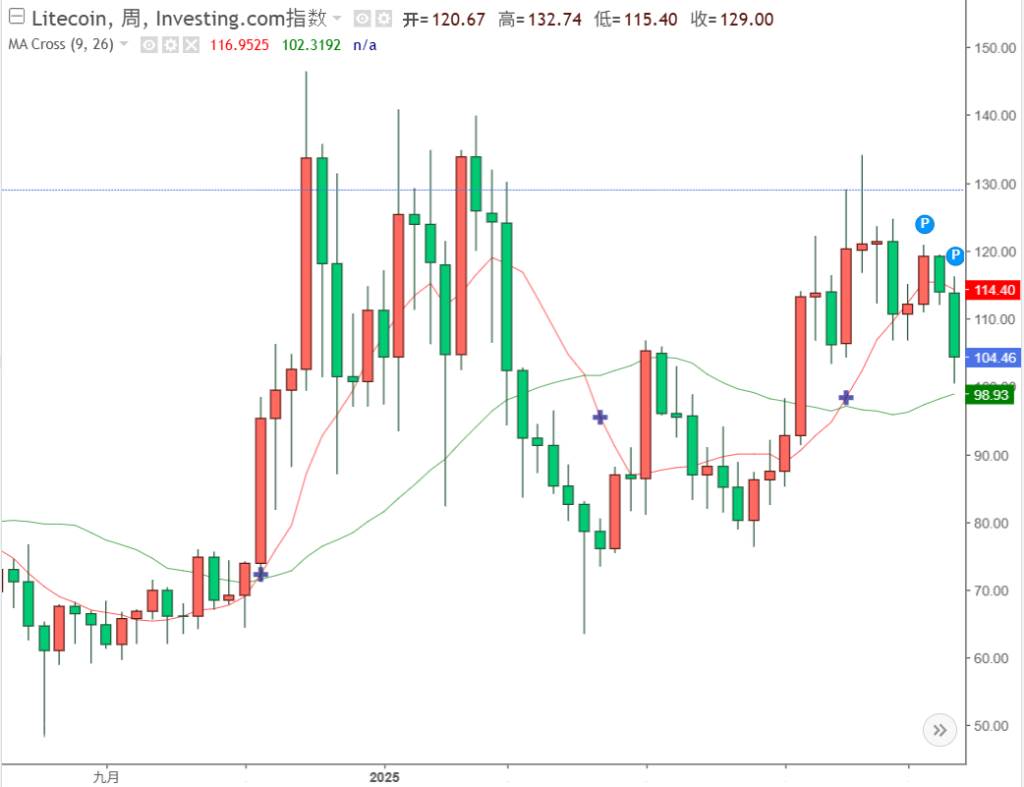
In December 2024, a golden cross (the 20-week line crossing the 100-week line) led to an increase in LTC prices to $147. However, after that, the price dropped back to $63 due to selling pressure. Since July, however, the trend has reversed, and prices have been rising steadily. The current price is stabilizing around $128, suggesting a possible strong rebound.
The RSI remains around 55, with no signs of overheating. If it can break through $140, it may challenge higher levels.
On daily charts:
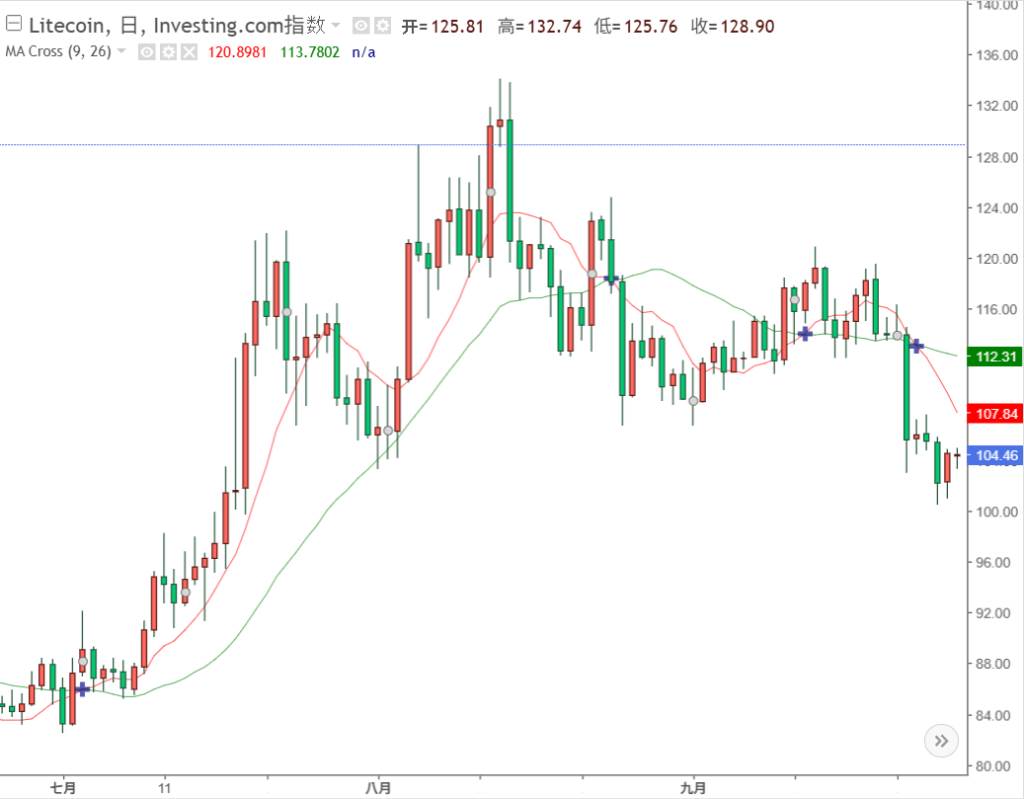
Since the golden cross occurred in July, prices have continued to rise along the 20-day moving average. The psychological support at $100 has been confirmed multiple times. The RSI is currently around 62, indicating further upside potential. If the price can break through the resistance at $135–140, short-term targets could be $150. If it encounters resistance, it might retest the $100–110 range.
Strategy recommendations:
● Entry points: Near $110, look for signs of rebound (e.g., small lower shadows, increased trading volume, RSI recovery).
● Profit target: First target is $135; further targets are between $150 and $155.
● Risk control: If the price falls below $100 and closes below that level, consider setting a stop loss to prevent losses towards $80–90.