Exchange Ranking
 Top Exchanges
 24h Volume Ranking
 Popularity Ranking
 Exchange BTC Balance
 Proof of Reserves
 Decentralized Exchanges
 Funding Rate
 Funding Heatmap
 Liquidation Data
 Max Pain
 Long/Short Ratio
 Whale L/S Ratio
 Binance/Okex/Huobi L/S
 Bitfinex Margin L/S
 ETF Tracker
 Solana ETF
 XRP ETF
 Hong Kong ETF
 Bitcoin Treasuries
 Crypto Reversal
 Ethereum Reserves
 HyperLiquid Wallet Analysis
 Hyperliquid Whale Watch
 Large Transactions
 On-chain Movement
 Bitcoin ROI
 Stablecoin Market Cap
 Options Analysis
 News
 Articles
 Economic Calendar
 Features
 Wallet
 Contract Calculator


 Security
 Collections
 Watchlist
 Following
 DOGE
Although the overall market conditions are volatile, one analyst pointed out that Dogecoin’s technical indicators are indicating potential significant changes. As long as key support levels remain stable, prices could experience a strong rebound. What’s more interesting is that, with Elon Musk frequently hinting at the possibility of integrating payment features into the X platform (formerly Twitter), and as community sentiment heats up again, DOGE isn’t just a joke-like “meme coin” anymore. It has the potential to reignite people’s imagination regarding the concept of “cryptocurrency payments.” In short, if market sentiment aligns with technical indicators, this “dog” might indeed start to move upward again.
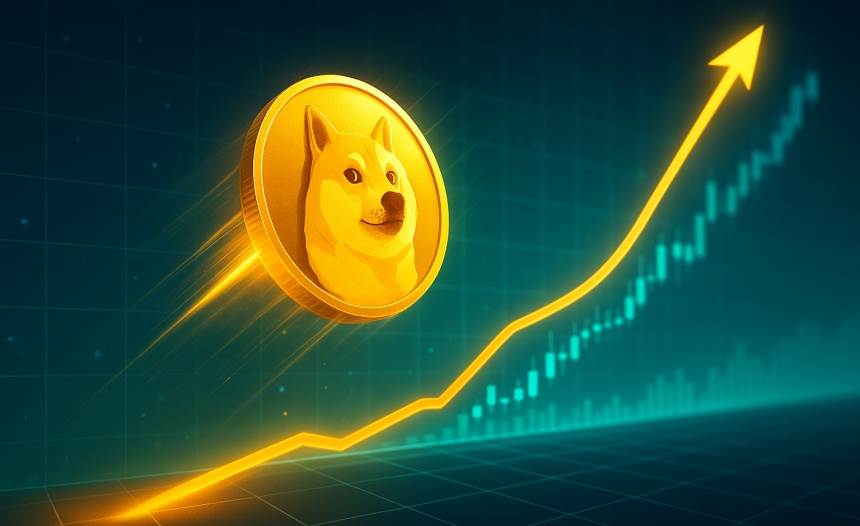
Dogecoin is testing the support lines of its ascending channel.
In a new article on the X platform, analyst Ali Martinez described a pattern that has formed on the 12-hour price chart of Dogecoin. This pattern is an ascending channel derived from technical analysis; it belongs to the category of parallel channels.
A parallel channel forms when asset prices consolidate between two parallel trend lines. The upper line of the channel serves as resistance, while the lower line acts as support.
When these trend lines slope upwards, the channel is called an ascending channel. When assets cross this channel, their prices may experience some net increase.
If any of these trend lines fails to hold, it could lead to a breakout in that direction. This means that a breakout from the channel could be a bullish signal, while a breakdown below the channel could be a bearish signal.
Similar to ascending channels, there is also a type of parallel channel called a descending channel. This channel appears when prices show net downward consolidation.
Now, here is the chart shared by Martinez, showing that the price of Dogecoin has been moving within an uptrend over the past few months:
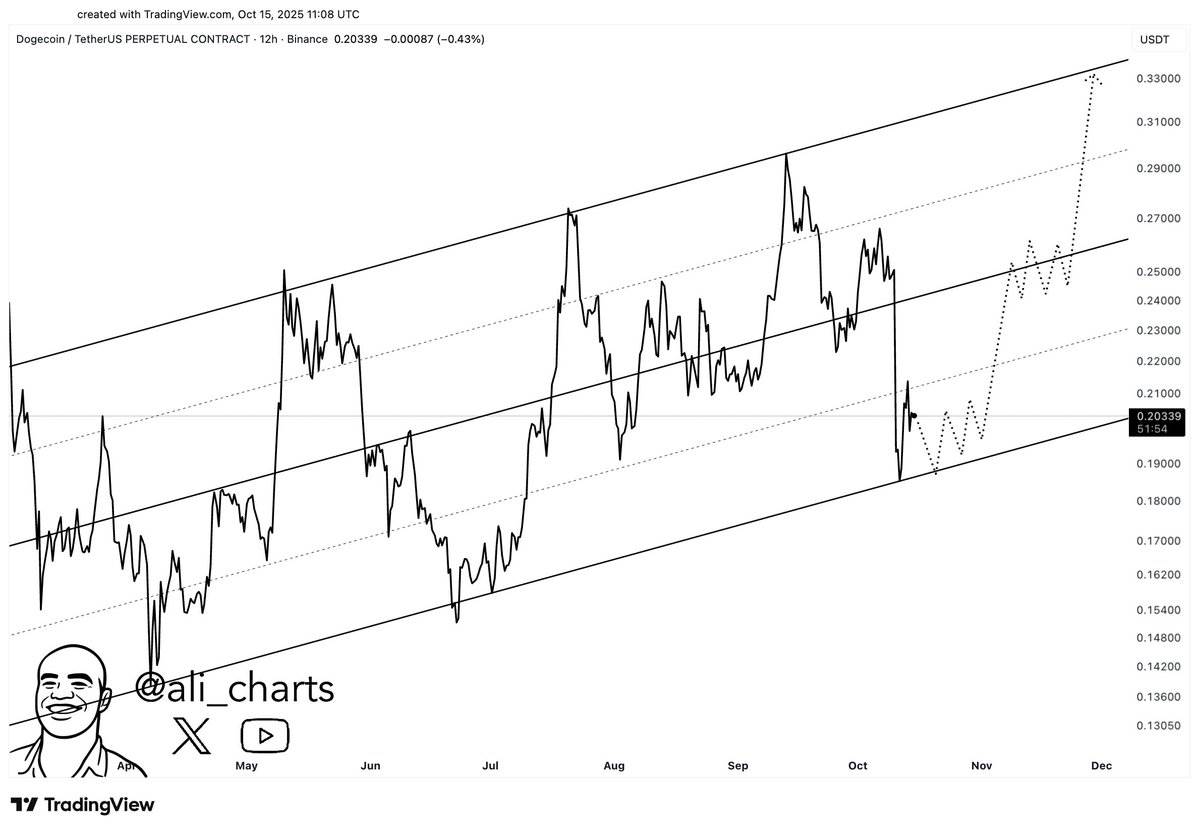
In the past 12 hours, the price of this token seems to have dropped to a lower level within the uptrend channel. Source: @ali_charts on X
As shown in the chart, Dogecoin tested the upper boundary of the uptrend channel in September, but encountered resistance. Since then, the price has fallen back to around $0.19.
Analysts say, “$0.19 is crucial for Dogecoin.” As mentioned earlier, a drop below the support level of the uptrend channel could indicate the continuation of a bear market.
If the support level is maintained, Dogecoin could experience a rebound. Martinez stated that in such cases, the next target for Dogecoin might be $0.33, which would be the resistance level of the uptrend channel. It remains to be seen what the price of Dogecoin will do in the coming days.
Previously, this analyst also shared a chart of the altcoin XRP, which is trading within a parallel channel. In this chart, the 12-hour price of XRP follows the parallel channel, with the trend line parallel to the time axis.
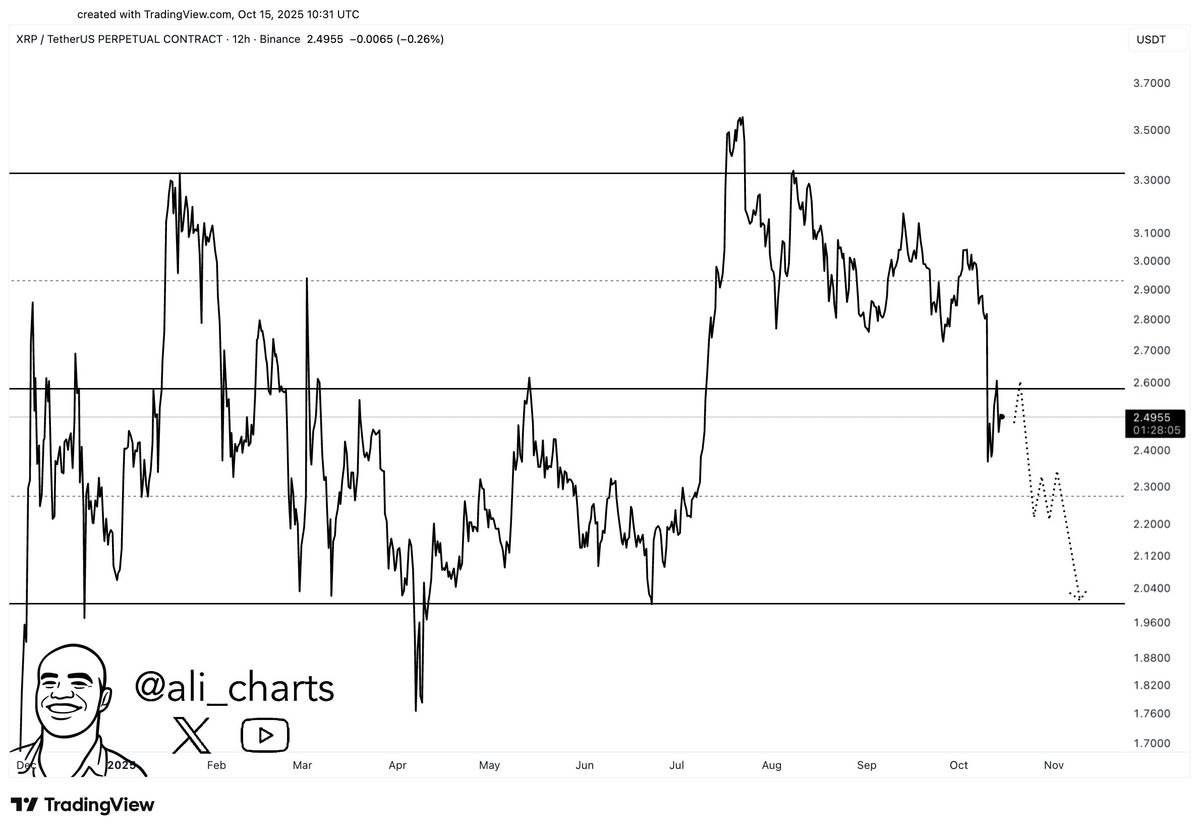
The 12-hour price of XRP has been following a parallel channel throughout the past year. Source: @ali_charts on X
From the chart, it can be seen that XRP has been falling within the channel recently, and may be testing a lower level, namely $2.
Dogecoin price
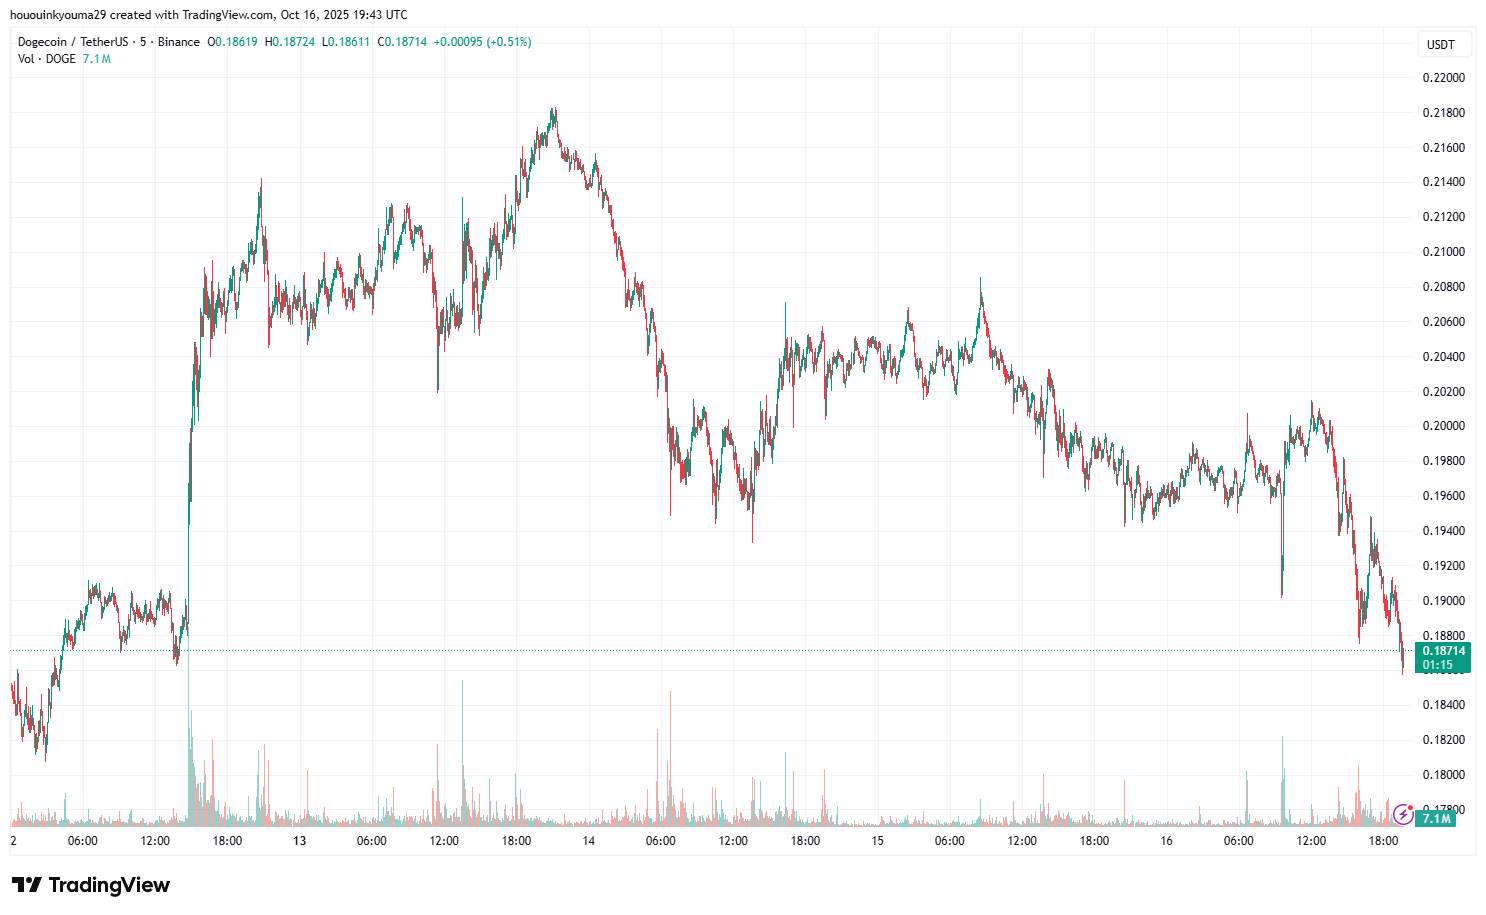
Token price trend over the past five days | Source: TradingView’s DOGEUSDT chart
At the time of writing, the price of Dogecoin was around $0.187, representing a decrease of 24% in just seven days.