Exchange Ranking
 Top Exchanges
 24h Volume Ranking
 Popularity Ranking
 Exchange BTC Balance
 Proof of Reserves
 Decentralized Exchanges
 Funding Rate
 Funding Heatmap
 Liquidation Data
 Max Pain
 Long/Short Ratio
 Whale L/S Ratio
 Binance/Okex/Huobi L/S
 Bitfinex Margin L/S
 ETF Tracker
 Solana ETF
 XRP ETF
 Hong Kong ETF
 Bitcoin Treasuries
 Crypto Reversal
 Ethereum Reserves
 HyperLiquid Wallet Analysis
 Hyperliquid Whale Watch
 Large Transactions
 On-chain Movement
 Bitcoin ROI
 Stablecoin Market Cap
 Options Analysis
 News
 Articles
 Economic Calendar
 Features
 Wallet
 Contract Calculator


 Security
 Collections
 Watchlist
 Following
 BTC
The crypto market showed a moderate rebound this week.
The crypto market showed a breather today. The total market value rose 2.1% on Friday to reach US$2.89 trillion. However, the rally only repaired part of the decline, as the market size exceeded $3 trillion a week ago when Bitcoin neared its annual high.
Despite the recovery in the market, traders remained cautious. The Fear and Greed Index has dropped to a neutral level of 56, a significant drop from 71 points in the "greedy" region on October 2.
Wall Street also showed nervousness. According to Decrypt's ETF tracking data, the Bitcoin ETF posted a net outflow of $484.9 million on Wednesday alone, its worst one-day performance since June 25, and lost a further $244 million on Thursday.
Technical Analysis of Bitcoin Prices
On Friday, Bitcoin traded at approximately US$82,837, up 1.38% within the day. The price fell to $80,427 on Thursday, the lowest level since early September. The opening price of the K-line that day was US$81,711, with a range of fluctuations between US$81,553 and US$83,443. Judging from the four-hour chart, prices are still below the 50-cycle exponential moving average, indicating that the short-term trend has not yet reversed.
Myriad, a forecasting market platform owned by Decrypt's parent company Dastan, shows that the probability of Bitcoin falling to or below $80,000 at some point in October is 67%, the probability of falling to $77,500 is 40%, and the probability of falling to $75,000 is 24%. 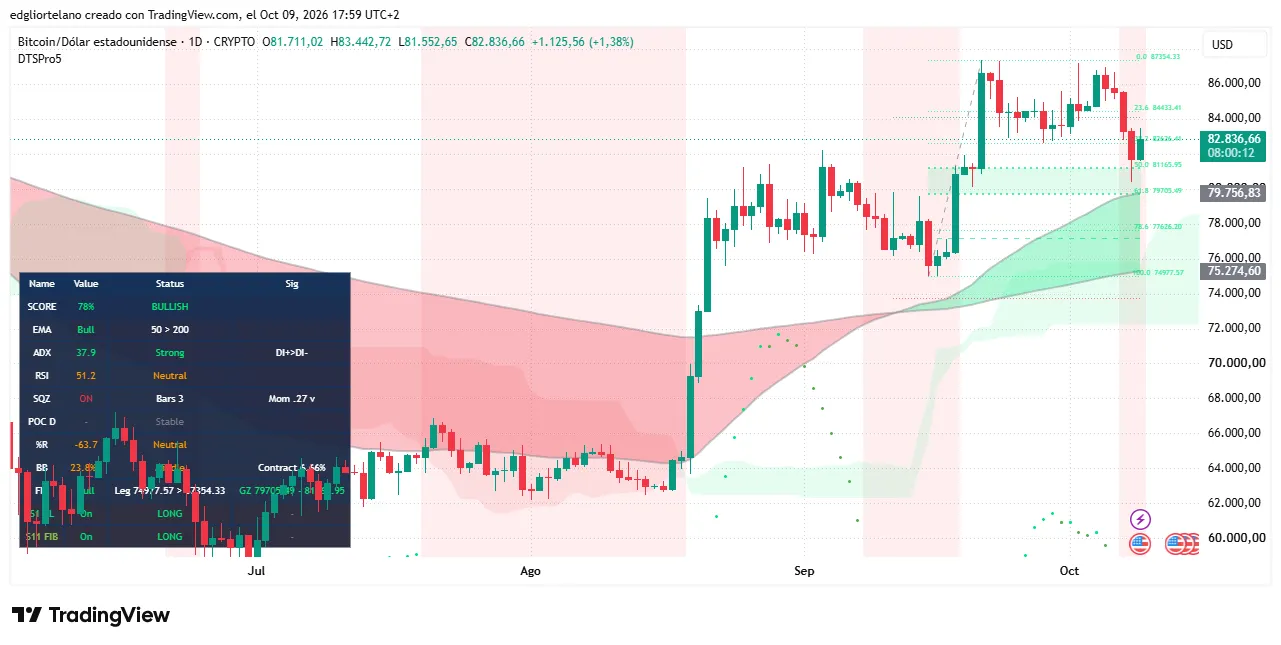 Another independent weekly market data shows a 49% probability that Bitcoin will close above $87,500 by the end of the week. This suggests traders expect prices to be compressed this month and there is still room for further downside.
Trend Indicator Analysis
The average directionality index (ADX), which measures the strength of a trend, regardless of direction, reads 37.9 on the daily chart, well above the 25 threshold needed to confirm a true trend. The directional line shows buyer power (DI+) is higher than seller power (DI-), so the overall trend remains bullish even after the correction.
The Relative Strength Index (RSI) is a measure of buying pressure and ranges from 0 to 100. Its current reading of 51.2 is at a neutral level, consistent with the Fear and Greed Index. This data is noteworthy because Bitcoin appears to be cooling down after going through an overbought phase.
Luke Deans of Bitwise Europe told Decrypt that the $83,000 region combines the ETF's average cost base with the previous higher high level, making it the first test position for this rally. If this position can be regained, the price range will look towards $84,433; the September high of $87,354.33 is a key resistance level that bulls need to break through daily closing prices.